
1. Meaning of a Demand Curve
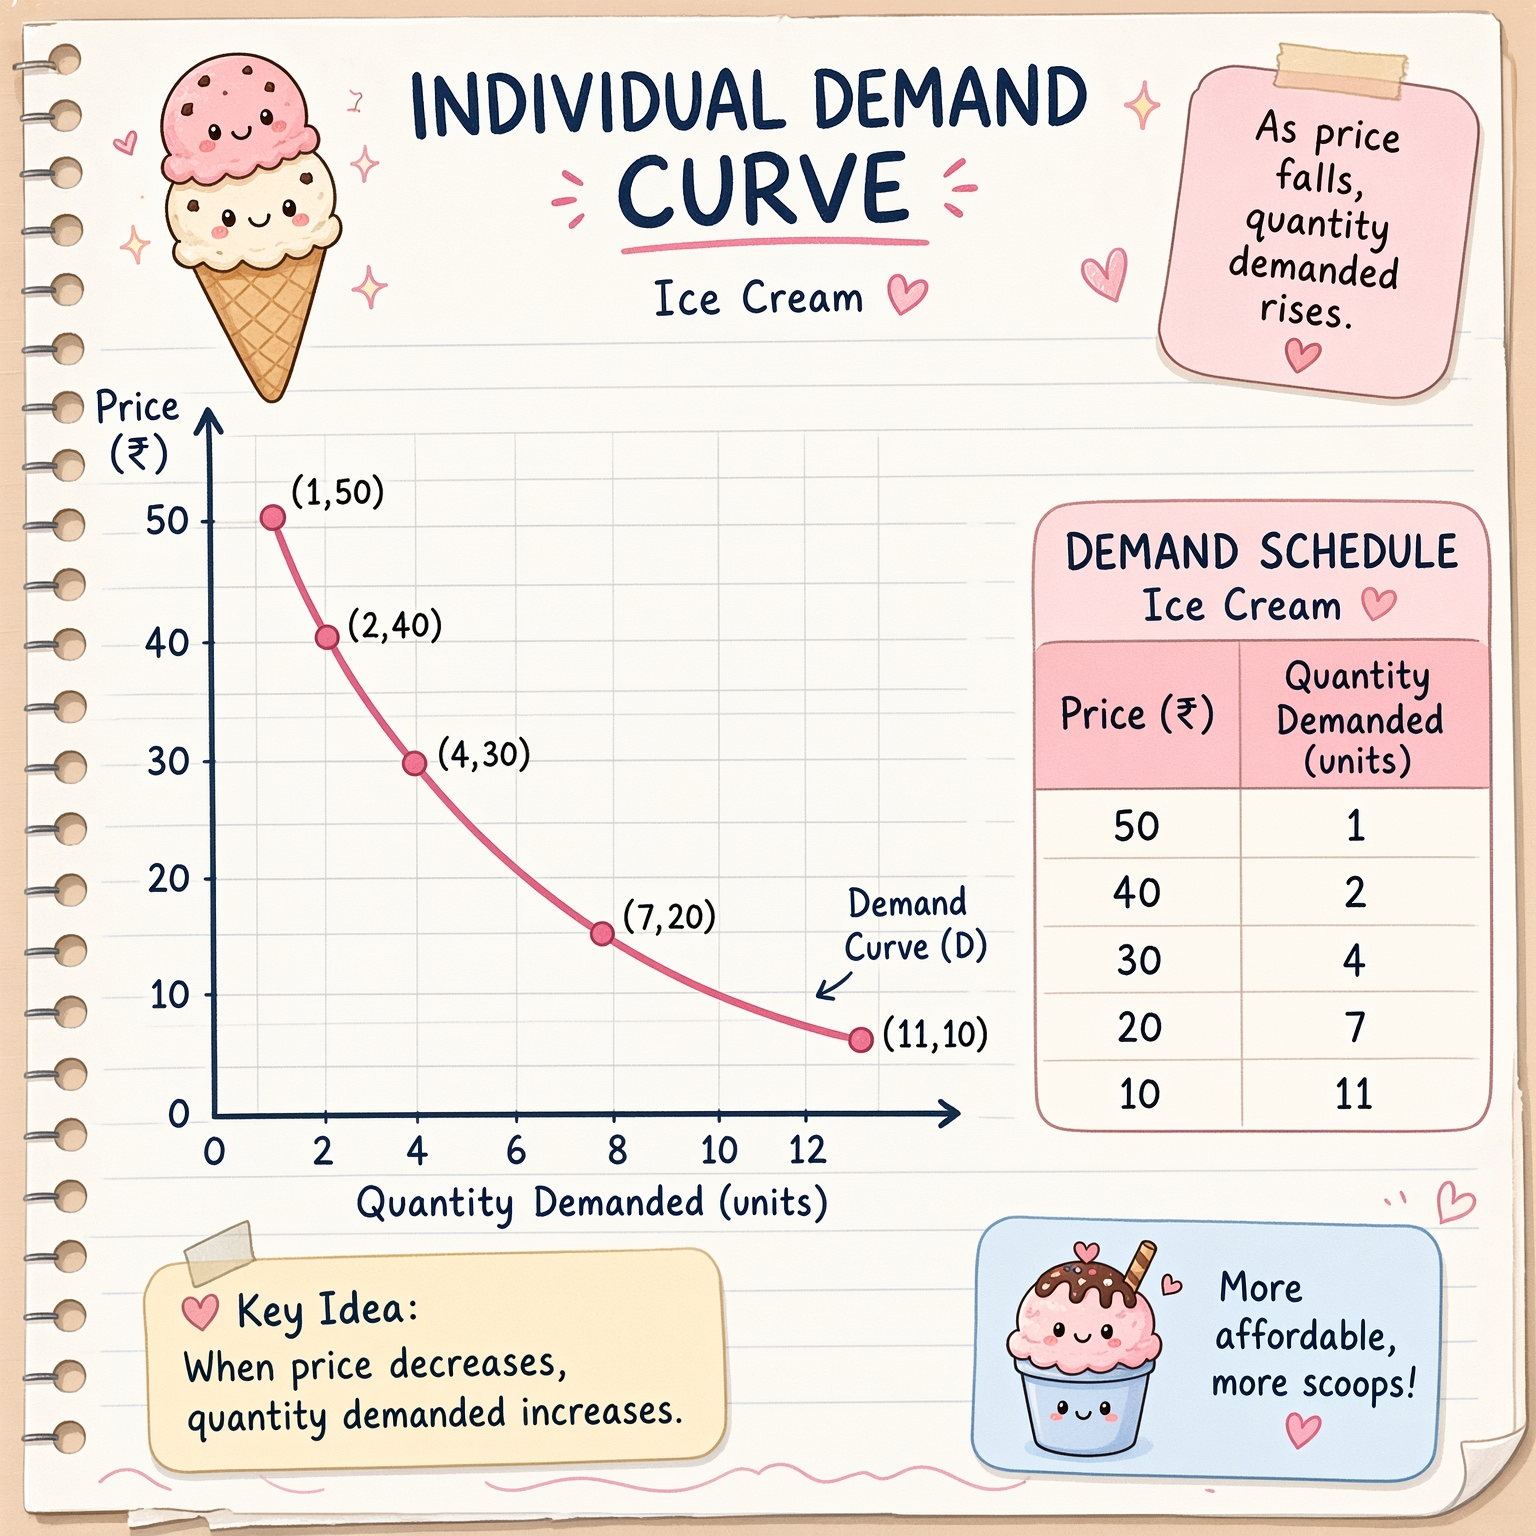
A demand curve is a graph that shows the relationship between the price of a commodity and the quantity demanded by a consumer.
It usually slopes downwards from left to right because people generally buy more of a product when its price falls and less when its price rises, other things remaining constant.
- Y-axis (vertical): Shows the price of the commodity.
- X-axis (horizontal): Shows the quantity demanded.
- Downward-sloping curve: Shows that price and quantity demanded usually move in opposite directions.
2. Hypothetical Individual Demand Schedule
A demand schedule is a table showing how much of a product one person is willing to buy at different prices.
| Price of ice cream (₹) | Quantity demanded (units) |
|---|---|
| 50 | 1 |
| 40 | 2 |
| 30 | 4 |
| 20 | 7 |
| 10 | 11 |
This table represents the individual demand of one consumer for ice cream.
3. Individual Demand Curve
The points on the graph are plotted using the demand schedule above. Price is shown on the vertical axis, and quantity demanded is shown on the horizontal axis.
| x | y |
|---|---|
Add row
Add More
12345678910111020304050−10
0,0
Give feedback
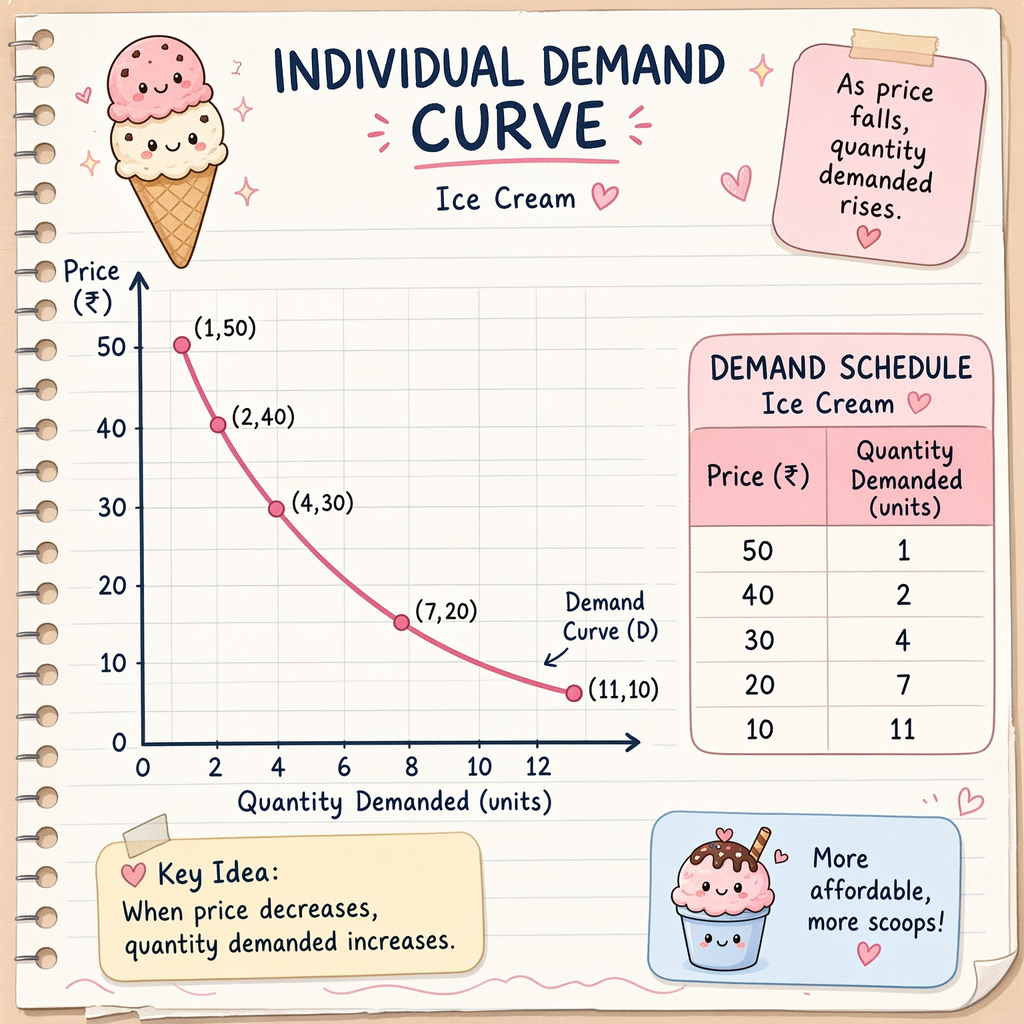
The graph slopes downwards from left to right. It shows that when the price of ice cream falls from ₹50 to ₹10, the quantity demanded increases from 1 unit to 11 units.
5. Conclusion
A demand curve is the graphical representation of a demand schedule. An individual demand curve usually slopes downwards from left to right, showing the inverse relationship between price and quantity demanded.
Exam tip: Remember: Y-axis = Price, X-axis = Quantity Demanded, and the demand curve slopes downwards from left to right.