There are two important methods:
(a) Tabulation
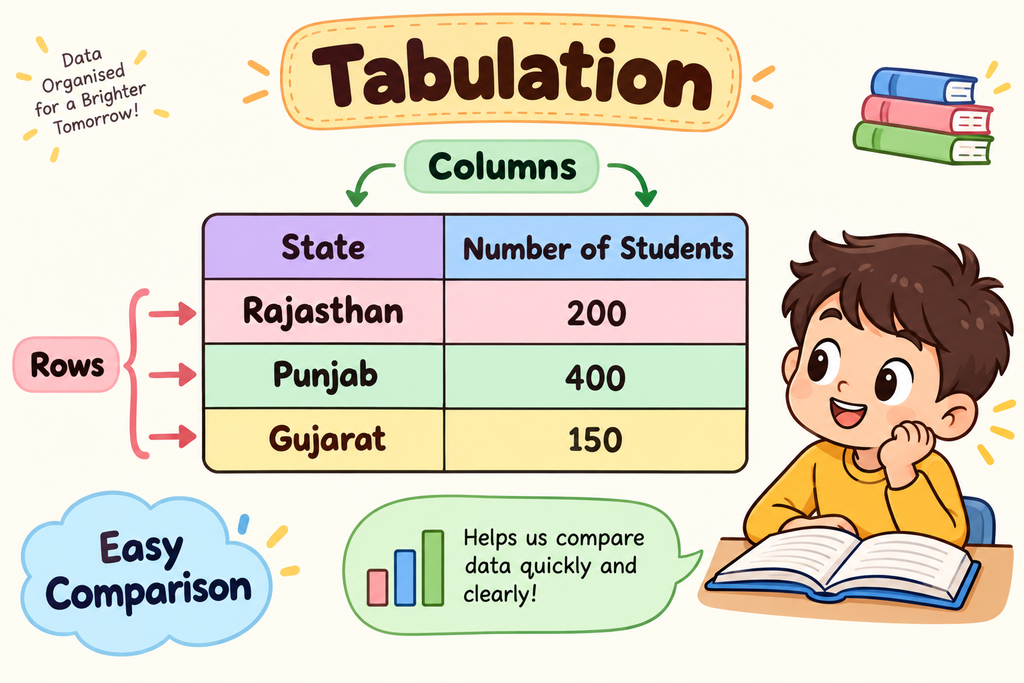
Tabulation means arranging classified data in rows and columns to form a table.
Purpose of Tabulation:
- Makes information easy to read.
- Helps compare different data.
- Makes analysis easier.
- Keeps information organised.
Example:
| State | Management Colleges |
| Rajasthan | 200 |
| Punjab | 400 |
| Gujarat | 150 |
This table is an example of tabulation.
(b) Diagram (Diagrammatic Presentation)
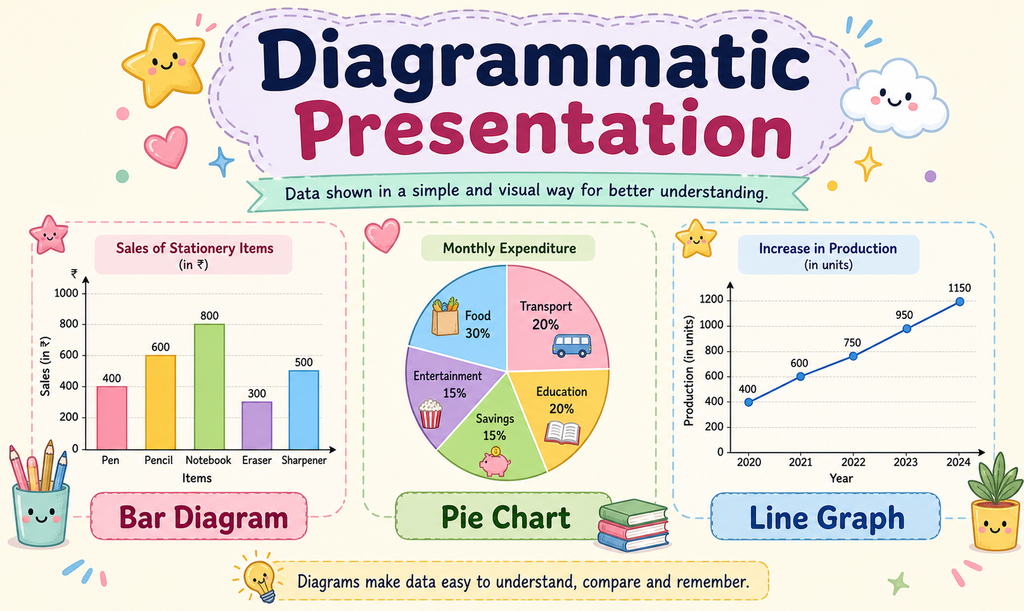
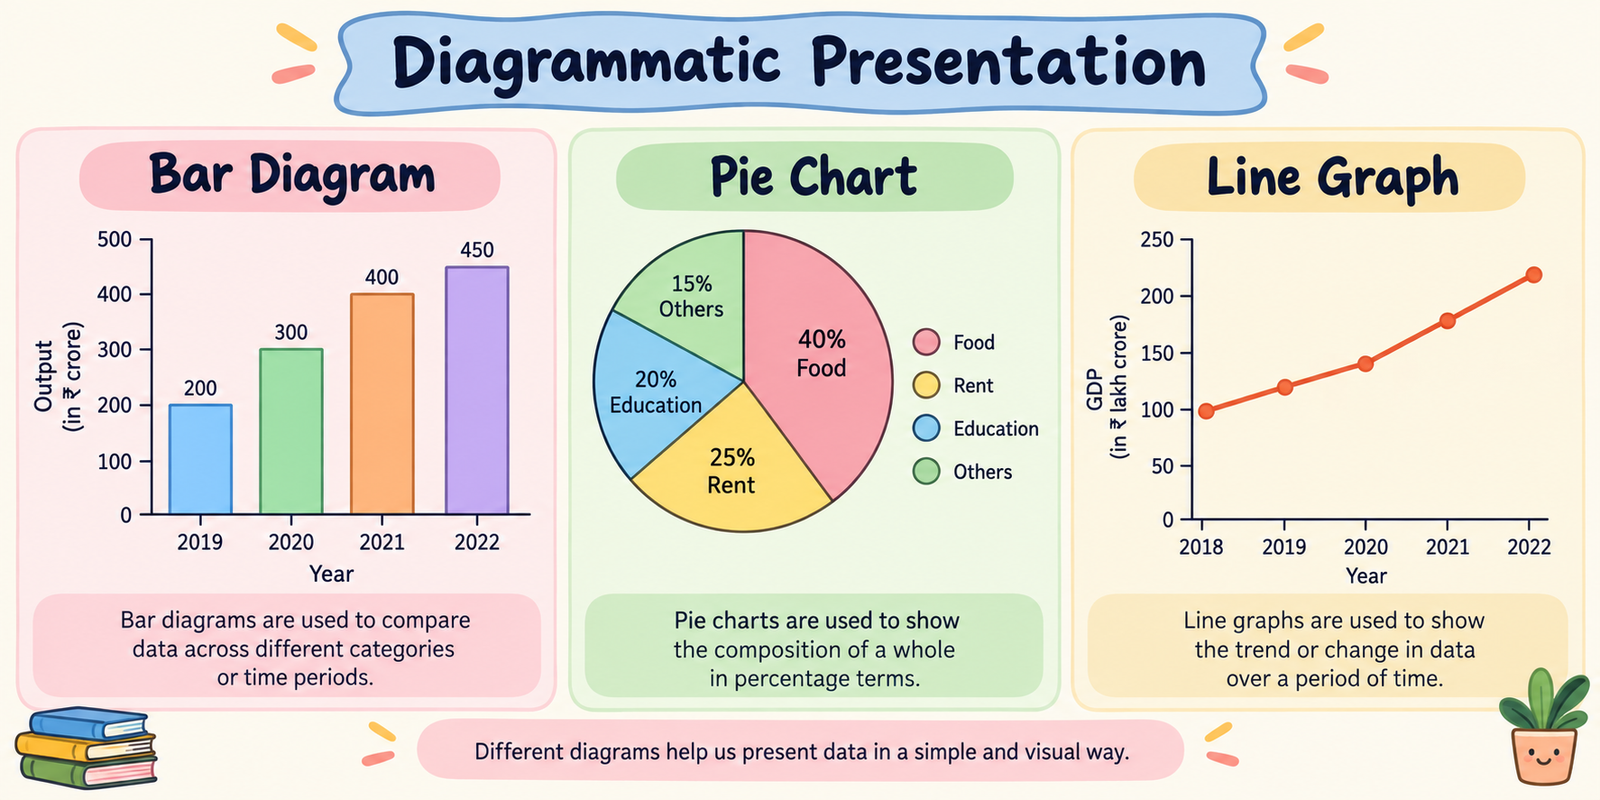
Diagrammatic presentation means showing data through pictures or diagrams.
It helps people understand information quickly.
Examples:
- Bar Diagram: Uses rectangular bars to compare values.
- Pie Chart: Uses a circle divided into different parts.
- Line Graph: Uses lines to show changes over time.
Purpose of Diagrammatic Presentation:
- Makes data attractive.
- Makes comparison easier.
- Helps people understand information quickly.
- Shows trends and differences clearly.