
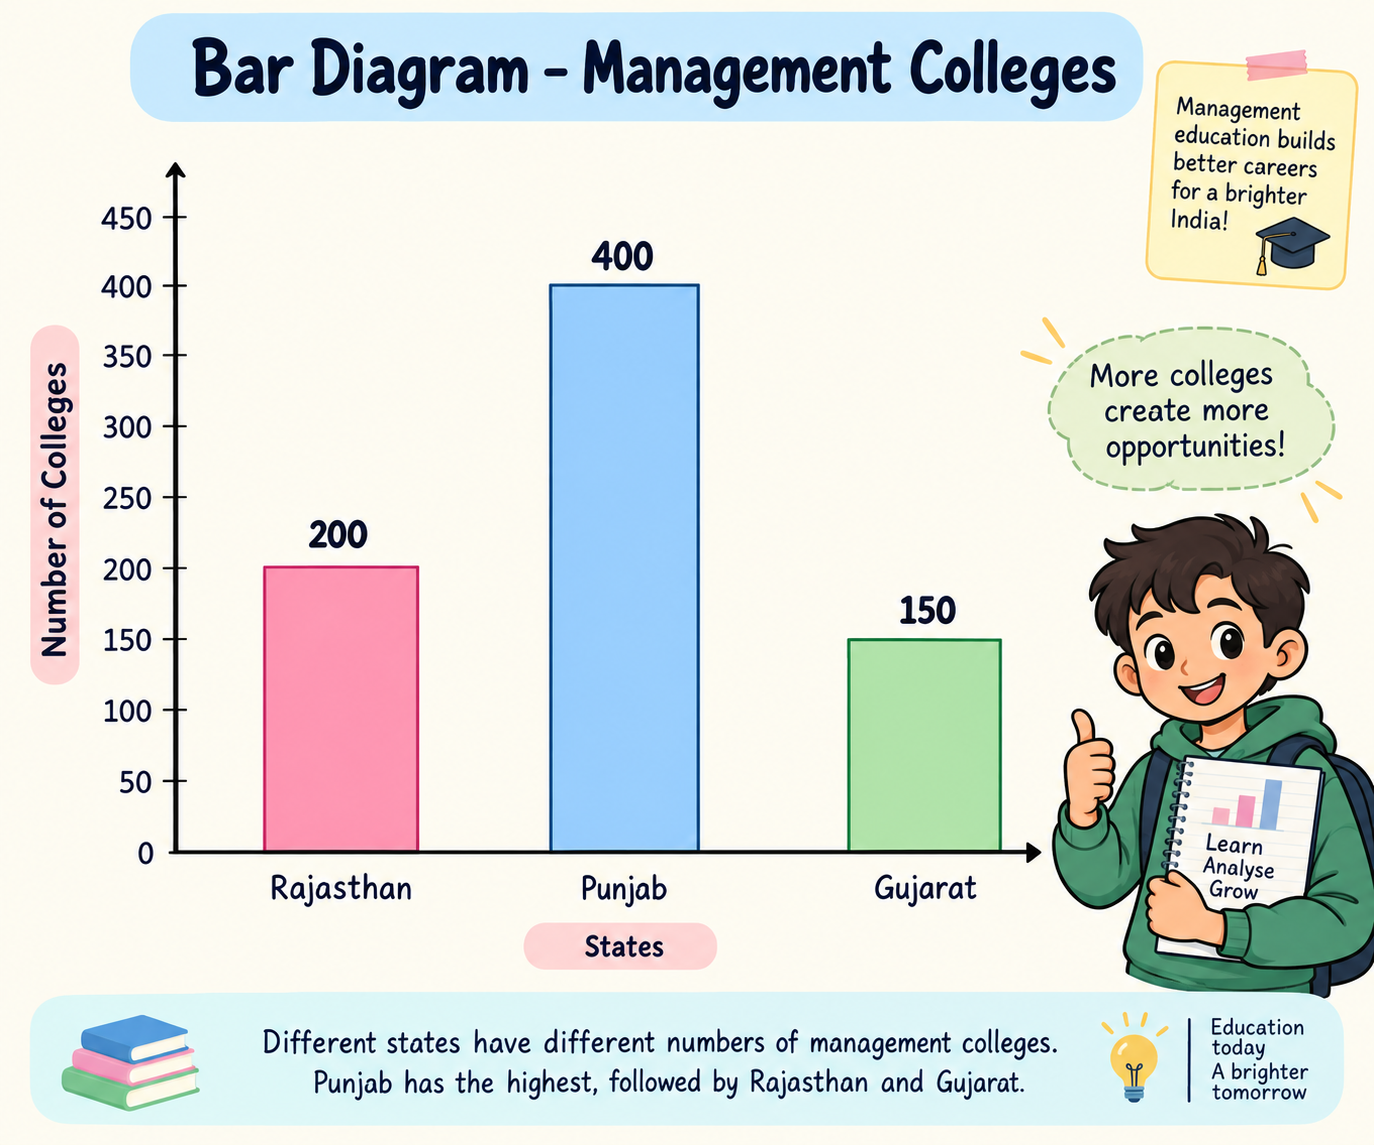
Given Data:
| State | Number of Management Colleges |
| Rajasthan | 200 |
| Punjab | 400 |
| Gujarat | 150 |
Steps to Construct a Bar Diagram
Step 1: Draw the X-axis and Y-axis.
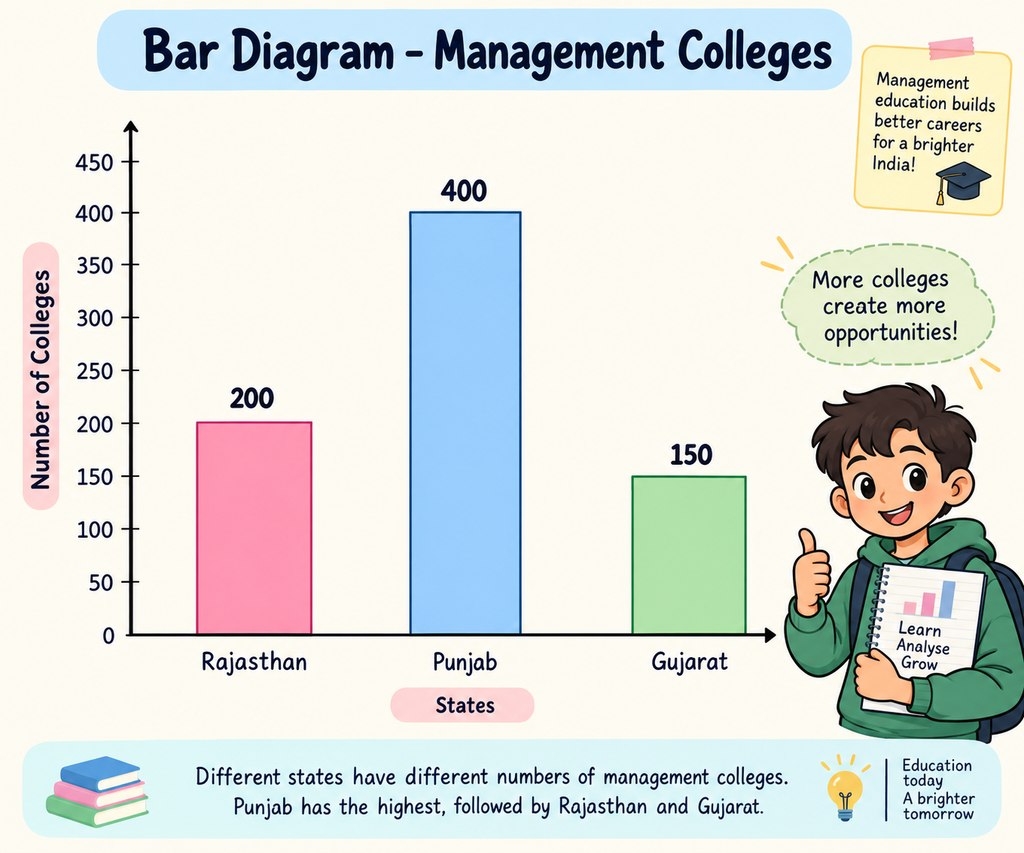
- X-axis (horizontal): Represents the names of states.
- Y-axis (vertical): Represents the number of management colleges.
Step 2: Mark the numbers on the Y-axis.
Use equal intervals:
0, 100, 200, 300 and 400.
Step 3: Draw three bars.
- Rajasthan: Draw a bar up to 200.
- Punjab: Draw a bar up to 400.
- Gujarat: Draw a bar up to 150.
Step 4: Keep equal spaces between the bars.
All three bars should have equal width and equal gaps.
Simple Bar Diagram (Text Representation)
Number of Management Colleges
400
Punjab
200
Rajasthan
150
Gujarat
Values are shown as labels; draw actual vertical bars on your graph sheet for the exam.
Important observation
- Punjab has the highest number of management colleges (400).
- Gujarat has the lowest number (150).
- Rajasthan has 200 management colleges.
Quick Revision Table
| Topic | Remember This |
| Data | Collection of facts and numbers. |
| Primary Data | First-hand information. |
| Secondary Data | Already collected information. |
| Variable | A characteristic measured in numbers. |
| Attribute | A quality or category. |
| Classification | Arranging data into groups. |
| Tabulation | Arranging data in rows and columns. |
| Diagram | Showing data through pictures or graphs. |
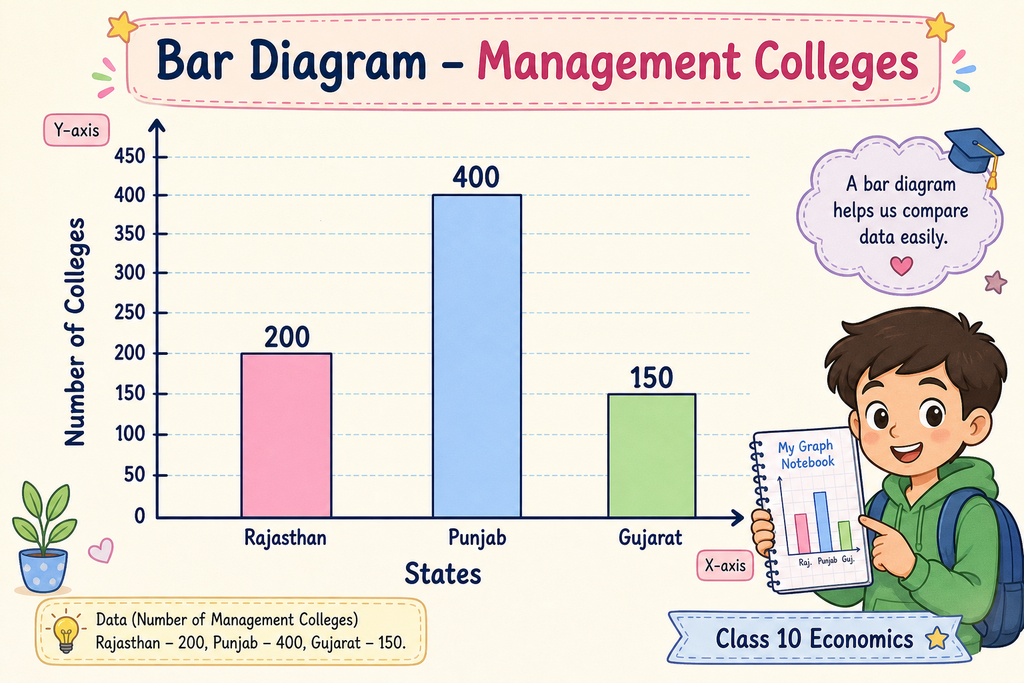
| Bar Diagram | Uses rectangular bars to compare values. |
| X-axis | Horizontal axis. |
| Y-axis | Vertical axis. |
Important Points to Remember for Exams
- Primary data = First-hand data.
- Secondary data = Already collected data.
- Variable = Numerical measurement.
- Attribute = Qualitative characteristic.
- Classification = Grouping of data.
- Tabulation = Rows and columns.
- Diagrammatic presentation = Visual presentation of data.
- In the given bar diagram, Punjab has the highest value (400).